Splunk Alert Manager
It sounds like you’re exploring a streamlined approach to managing security events across various data sources, which can indeed be overwhelming. SIEMs play a critical role in consolidating logs from diverse platforms, enabling easier querying of data. Enter the Splunk app Alert Manager—a solution designed to establish a centralized alert queue for alert assignment and response. This post will guide you through setting up Alert Manager and provide an introduction to using the Splunk App. For a more comprehensive understanding, you can delve deeper into the platform by referring to the documentation available here.
Setting up Splunk
To get started, you’ll require a configured Splunk Enterprise server. You can easily access a free trial version of Splunk Enterprise by signing up through this link.
After downloading Splunk to your Linux host using wget, execute the following commands to install and initiate Splunk. Ensure to enable automatic boot start to ensure Splunk restarts if your host undergoes a restart.
1
2
3
4
5
6
7
8
9
wget -O splunk-9.0.2-17e00c557dc1-linux-2.6-amd64.deb "https://download.splunk.com/products/splunk/releases/9.0.2/linux/splunk-9.0.2-17e00c557dc1-linux-2.6-amd64.deb"

sudo apt install ./splunk*.deb

cd /opt/splunk/bin

sudo ./splunk start

sudo ./splunk enable boot-start
Installing Alert Manager
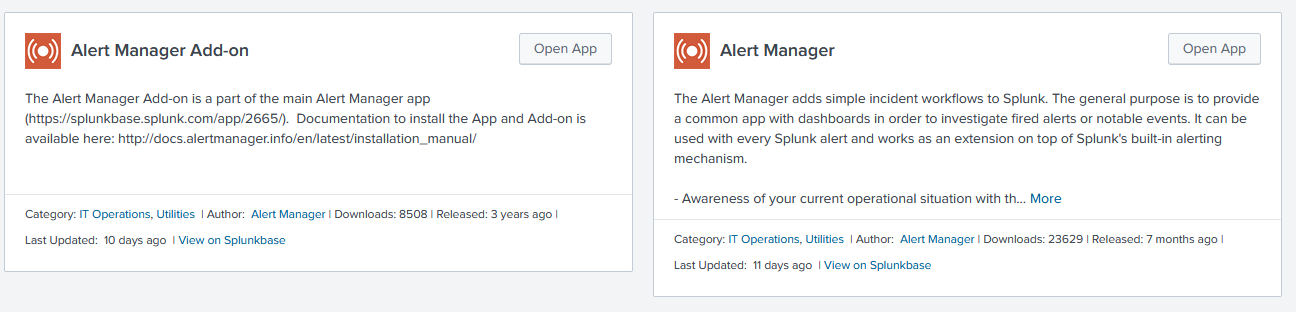
Once you setup and configure Splunk how you wish go to the main Splunk page and click “+ Find More Apps” and search “Alert Manager” which will then show you the two apps Alert Manager and Alert Manager Add-on. Make sure you install both of these.
Configure Alert Manager
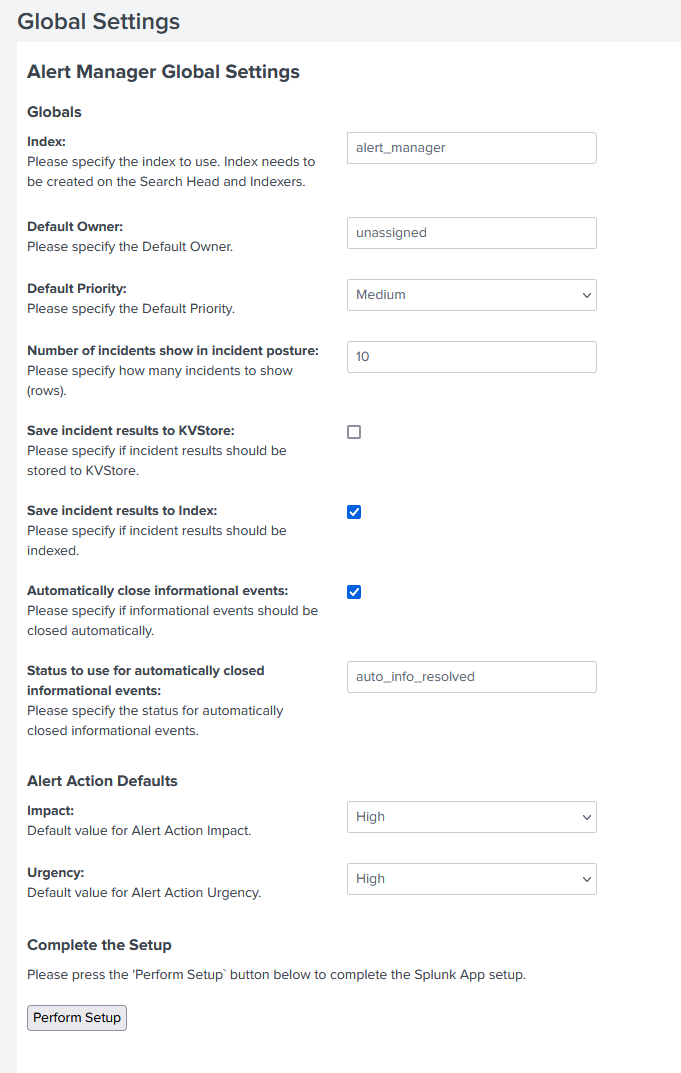
Once both apps are installed you will need to restart your Splunk instance and then proceed to go back to the main page of Splunk. You will now see the app Alert Manager on the side. Click that and you will be presented with the initial configuration. Here you can update the settings to how you would like. By default all data for this app is written in the main index. You can create a new index for alert manager if you wish. You can configure this to whatever best suits your organization. Below is an example of my configuration. Once configured click Perform Setup. You might need to restart Splunk one more time for changes to take place.
Overview Setup
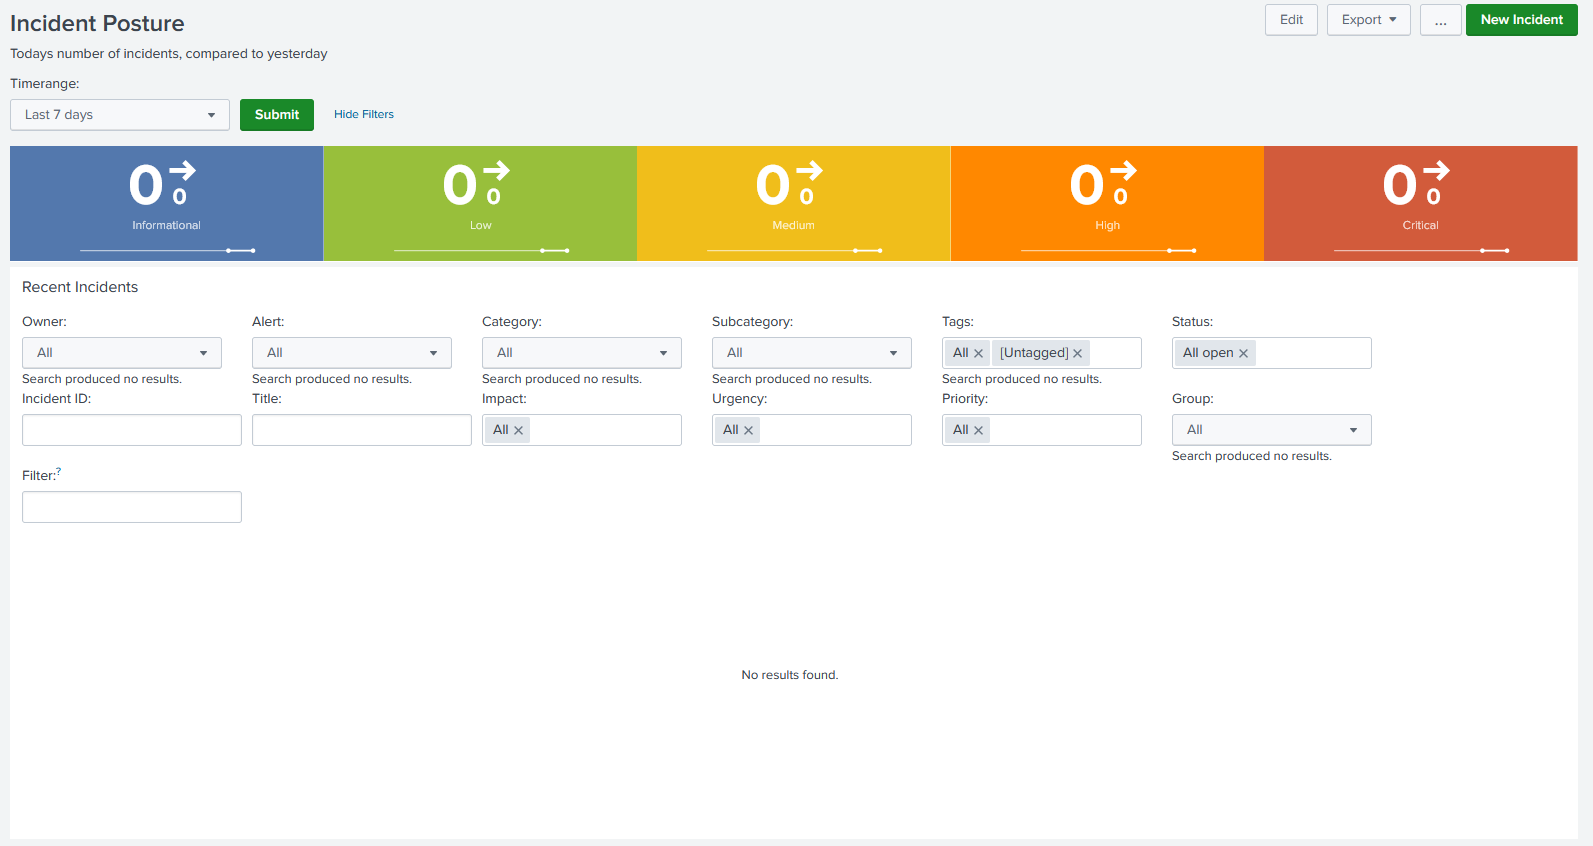
When first logged in you will be presented with your alert overview page showing you the type of alerts that have come in. At first there will be no alerts present in this output as none have been created yet. As you can see the overview shows you the number of type of alerts in a timeframe and there are many filter options to pull specific alerts once created.
Creating Alerts
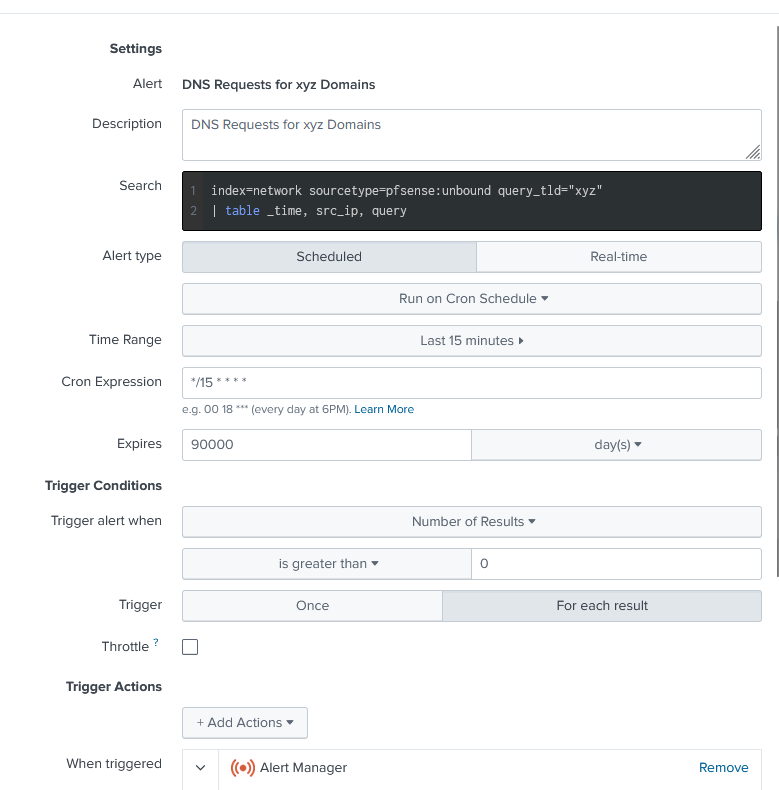
With Splunk Enterprise creating alerts is pretty straightforward and works very smoothly with Alert Manager. To create an alert go to Splunk and click Settings > Searches, reports, and alerts > New Alert. You will be presented a place to put your Splunk search along with metadata about your search. I recommend using cron expressions in order to schedule your jobs to run. I also recommend selecting the trigger for each result so I have an individual alert per result that comes from my Splunk search. Once configured make sure you add a trigger action and point it to Alert Manager.
When clicked you will then be able to configure the properties of your alert and how it will populate in Alert Manager. This can change based on the severity of each alert. Update this section for how you want your alert to be presented.
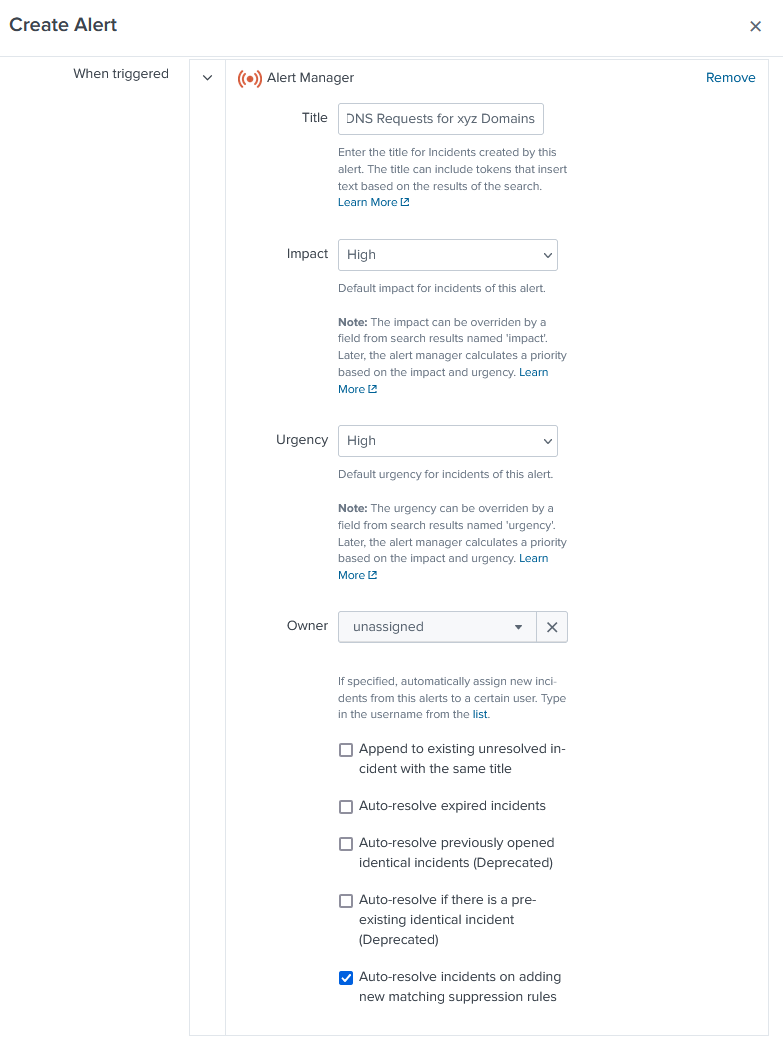
Below are two alerts I will be using to show off Alert Manager.
DNS Requests for .xyz Domains
1
2
index=network sourcetype=pfsense:unbound query_tld="xyz"
| table _time, src_ip, query
Firewall Beacons
1
2
3
4
5
6
7
8
9
10
11
index="network" sourcetype="pfsense:filterlog" src_ip="192.168.*" dest_port="443" earliest=-5d
| fields - _raw
| fields _time dest_ip src_ip
| eval time1=_time
| eval time2=_time
| bin time1 span=1d
| bin time2 span=2h
| stats earliest(time1) as firstTime latest(time1) as lastTime dc(time1) as day_freq, dc(time2) as hour_freq, by src_ip dest_ip
| eventstats dc(src_ip) as dc_src_ip, by dest_ip
| where day_freq>3 AND hour_freq>4
| convert ctime(firstTime) ctime(lastTime)
As a side note it is great to store your alert logic in a git repo on internal/private to your group. This allows you to better maintain and manage your alerts. If you need to revert any changes a previous version of the alert will also exist. You can use multiple platforms such as GitHub, Bitbucket, Gitea, GitLab, or other git servers.
Working Alerts
Once your Splunk alert runs and returns results you should start to have alert(s) populate in Alert Manager. It should look similar to the image below.
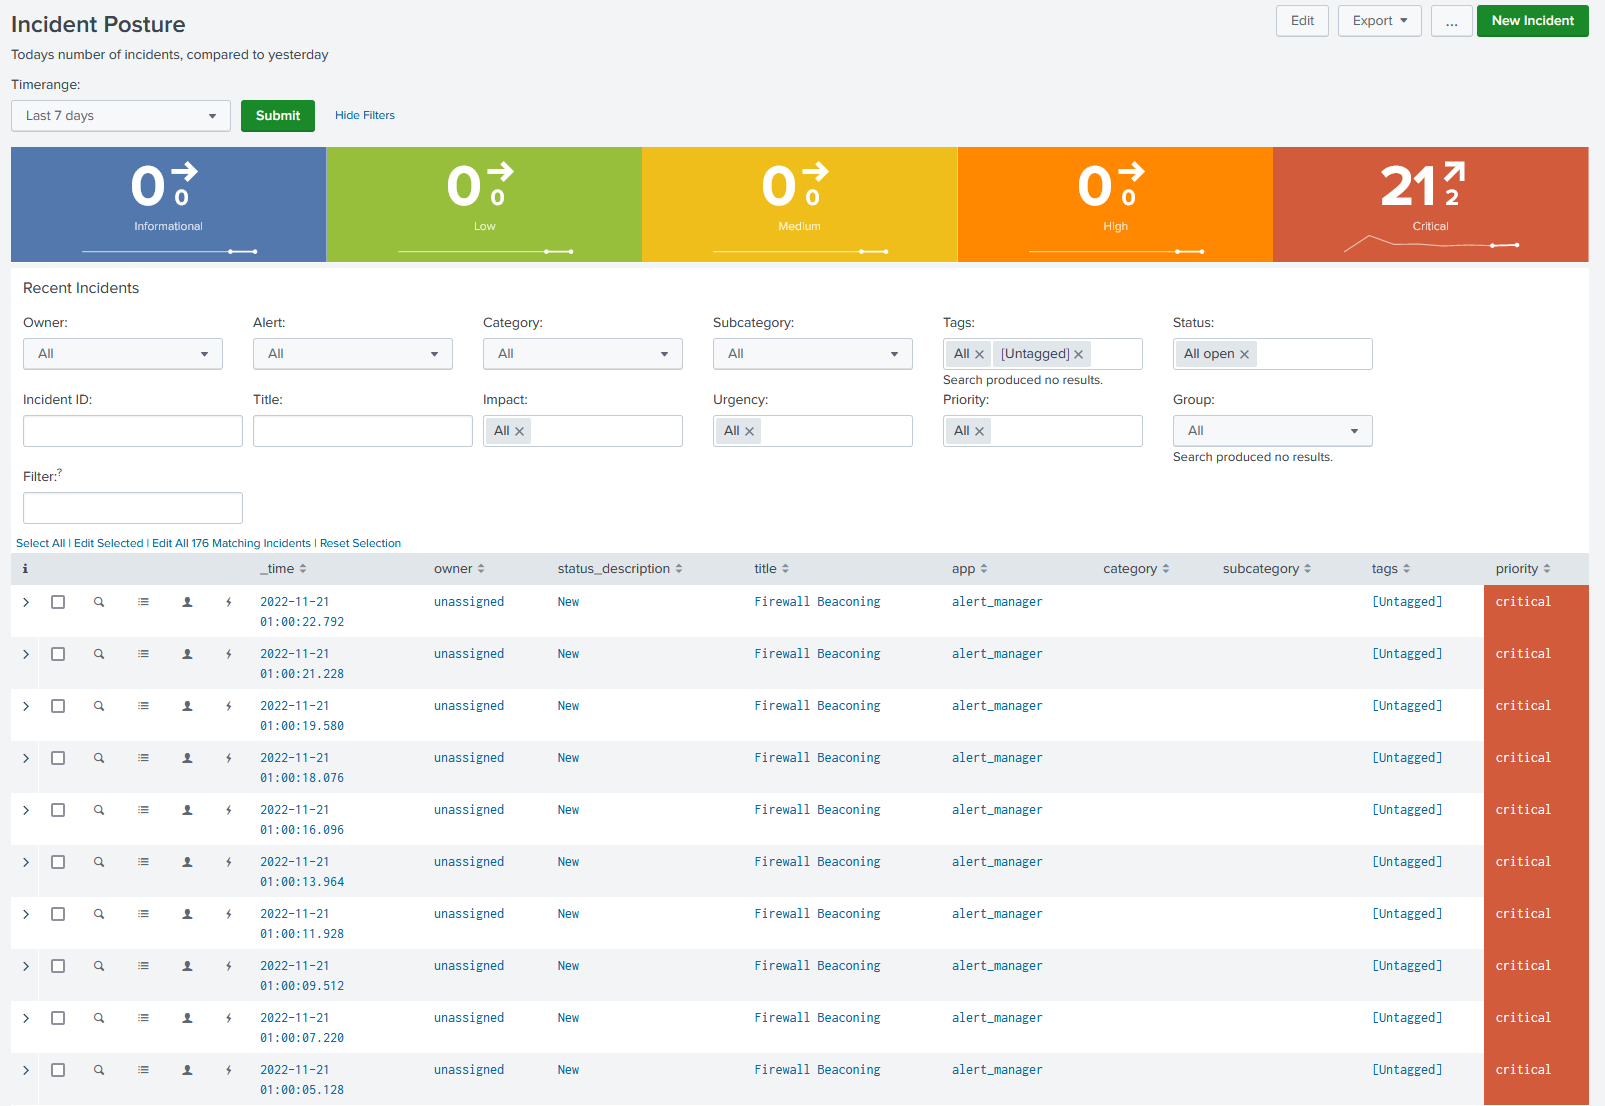
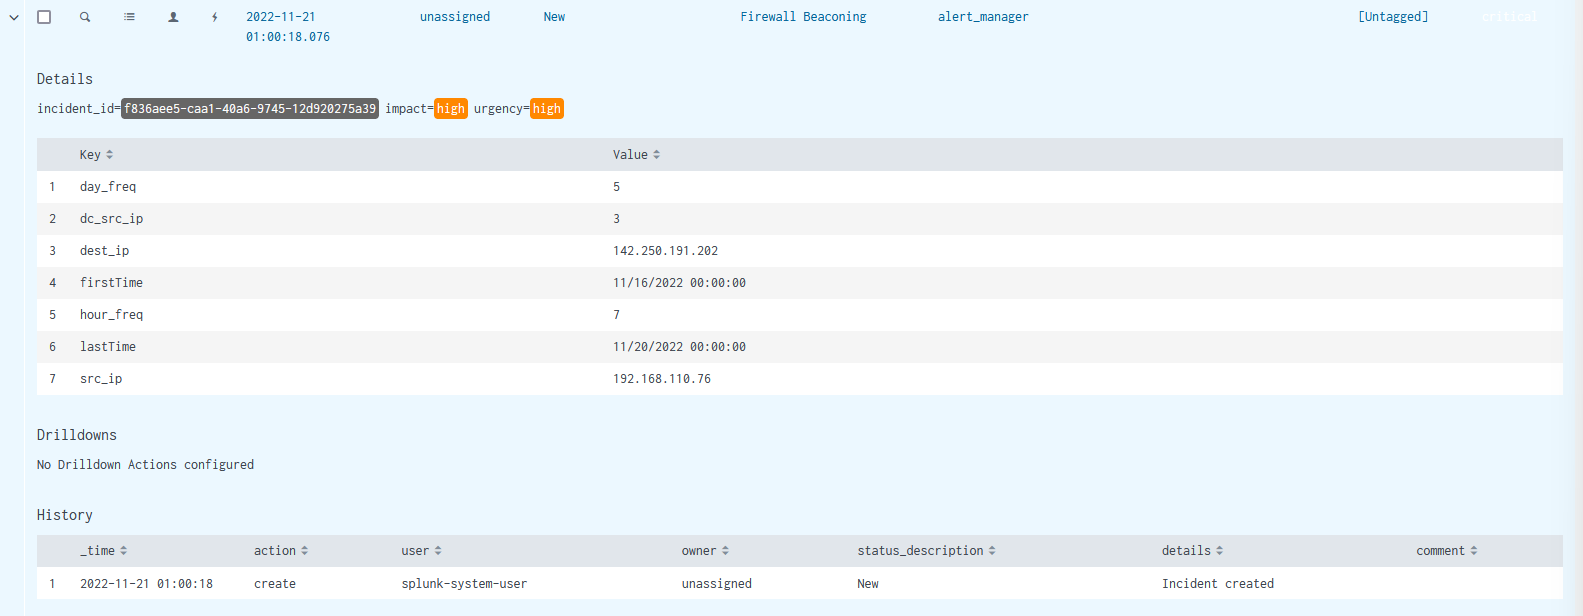
You can expand on any alert by clicking the dropdown next to it or you can see the alert results by clicking on any alert. Below is the screenshot of one of the alert details. As you can see this alert is not assigned and in the new status. You can assign alerts to yourself by clicking the person icon. This will update history details for the alert. You can click the magnifying glass icon to show you the search in the time frame that returns results.
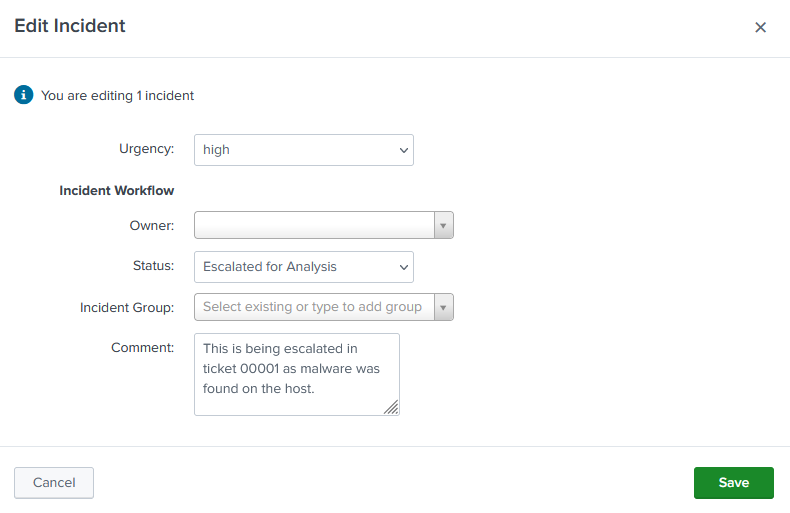
Clicking the three line icon you can edit the alert. This is where you can update the status of the alert, change owner, and add comments. The below example shows this alert is being Escalated for Analysis with a comment stating why.
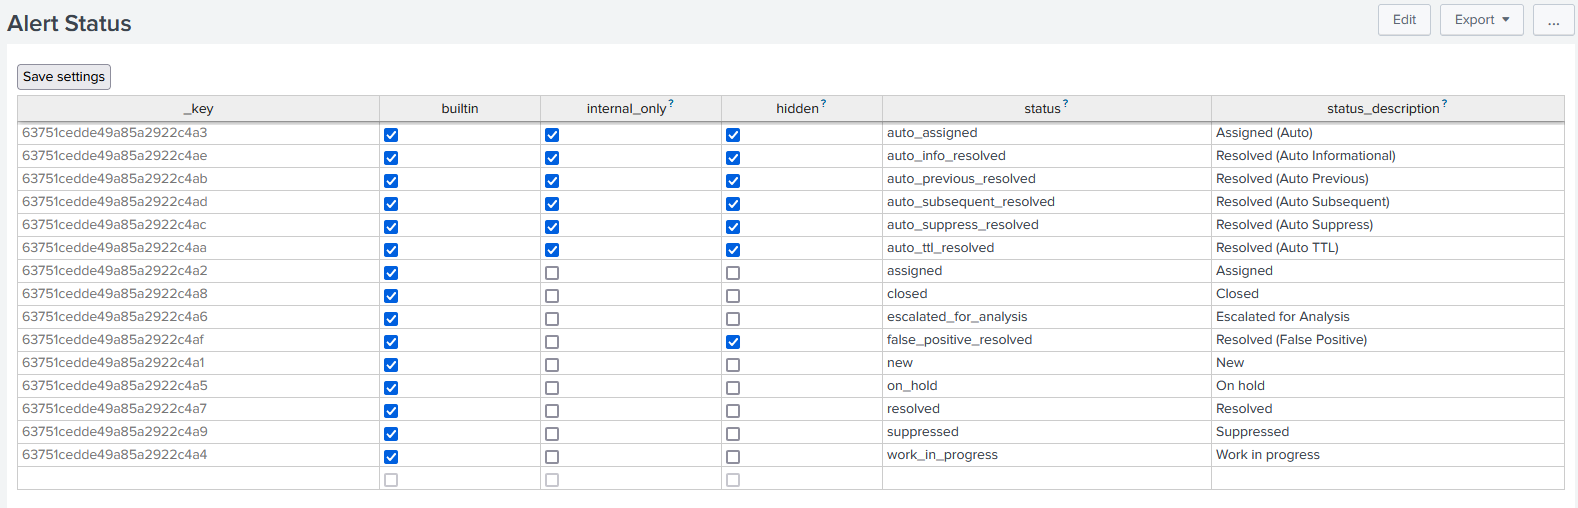
If you would like to add, update, or remove alert statuses that can be done in Alert Manager by going to Settings > Alert Status. Below is the default configuration for my Alert Manager App.
Suppressing Alerts
Now that you have alerts, what do you do in order to not overwhelm your analysts with false positives and potential misses due to alert fatigue. The first thing you should do is make sure your alert logic is solid and is refined as best as you can. Now this is not always possible or your environment may change frequently so that your logic may pick up more false positives over time. This is where Suppression Rules come in.
In Alert Manager go to Settings > Suppression Rules > Add Suppression Rule. This will give you the first step in creating a Supression rule. Give the rule a name and description and mark it as a false positive. Then define the scope which is the name of the saved search and it will compare it againist any saved searches that match. You can use * as a wildcard. Then click save to save the suppression rule.
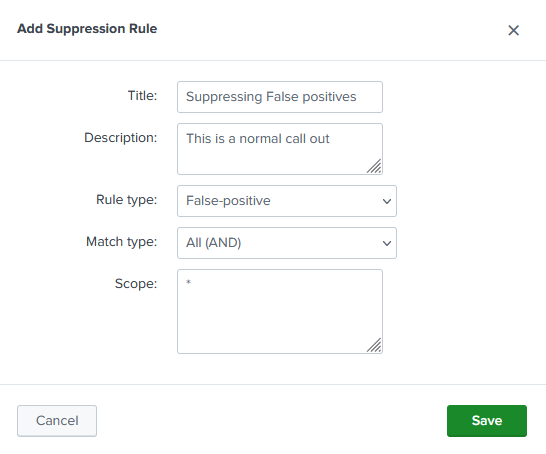
Now you can click on the rule name and add fields that should be looked for. The format for the field value is $result.fieldname$, a condition, and value. Once you add all your conditions click save. Now the next time your alert runs it will evaluate the suppression rule to the specified alert. The rule will be marked as suppressed if it does match. Below is an example of a suppression rule.

Other Notable Features
As I mentioned in the beginning this post will be used as an overview of Alert Manager. Some other notable features Alert Manager has are and would be good to dig into further are:
- Incident Overview
- KPI Reports
- Incident Exports
- External Workflows
Please refer to the official documentation for Alert Manager to see the most up to date information and in depth look at features.